A Little Perspective


As recently as a few months ago, doctors were held in high esteem and educated people believed that medicine could be useful. All that changed, of course, with the medical profession’s stunning failure to prevent or even predict the breakout of ebola in West Africa. Worse yet, many doctors to this very day cling to their old ways of thinking, writing prescriptions, setting broken bones, and performing surgery in bull-headed defiance of the urgent need to jettison everything we know about medical practice and start over from scratch.

Nobody, of course, writes such nonsense about medicine. Why, then, do so many write equivalent nonsense about economics?

Most economists failed to predict the 2008 financial crisis and ensuing recession for pretty much the same reason most doctors failed to predict the 2014 ebola epidemic — their attention was, quite reasonably, directed elsewhere. It’s easy to say in hindsight that if economists had paid more attention to the shadow banking system, they’d have seen what was coming. But attention is finite, and if economists had paid more attention to the shadow banking system, they’d have paid less attention to something else.

For a little perspective, have a look at this chart showing U.S.~per capita income in fixed (2005) dollars:

That little downward blip you see near the top is the recent crisis. The somewhat bigger downward blip in the 1930s is the Great Depression. The moral is that in the overall scheme of things, recessions don’t matter very much. At the trough of the Great Depression, people lived at a level of material comfort that would have seemed unimaginably luxurious to their grandparents. Today, while Paul Krugman continues to lament “the mess we’re in”, Americans at every income level live far better than Americans of, say, 1980. If you doubt that, you surely don’t remember what life was like in 1980. Here’s how to fix that: Pick a movie from 1980 — pretty much any movie will do — and count the “insurmountable” problems that the protagonist could have solved in an instant with the technology of 2014. Or reread any of the old posts on this page.

If you care about human well-being, recession-fighting is small potatoes. It’s that long-term upward trend that matters. And economists, fortunately, understand a lot about what it takes to nourish that trend — things like well-enforced property rights, the rule of law, free trade, sound money, limited regulation and low marginal tax rates. Even more fortunately, economists have managed, however imperfectly and with fits and starts, to impress that understanding on the minds of policymakers. As a result (and going back, at least, to the repeal of the Corn Laws), we’ve had better policies and greater prosperity.

To throw out all that hard-won knowledge because we failed to prevent a financial crisis would be like closing all the hospitals because doctors failed to prevent an epidemic.

Moreover, it’s entirely possible that some of the best policies for fighting recessions are inimical to long-term growth. It could easily follow that even if you knew exactly how to fight recessions, you might prefer not to.

It’s a very good thing that some economists are trying to understand recessions, and a very good thing that they’re accounting for the lessons of the past few years. It’s also a very good thing that most economists are working in the myriad of other areas where we’re capable of doing good. Another very good thing is historical perspective. The current so-called “mess” that economists have (partly) gotten us into is not just the most prosperous era in human history; it is prosperous beyond the wildest imaginings of your parents’ generation. And yes, economists helped get us here.

Share/Save

A Little Perspective
Steve Landsburg
Mon, 06 Oct 2014 06:01:23 GMT

How Obama Is Caught Between Economic Growth and Shrinking Incomes


In President Barack Obama‘s big speech on the economy Thursday, the president touted his party’s economic agenda and repeated a claim similar to one he’s made before: “It is indisputable that our economy is stronger today than it was when I took office.”

Then he added, “It is also indisputable that millions of Americans don’t yet feel enough of the benefits of a growing economy where it matters most — in their own lives.”

Behind Mr. Obama’s frustration: A striking divergence between the growing economy and the share of that growth going as income to the median American household.

In the economic expansions of the 1980s and 1990s, roughly coinciding with the presidencies of Ronald Reagan and Bill Clinton, the amount of gross domestic product for each person in the economy, or GDP per capita (red in all the charts), was growing. And the median household income — the earnings of the middle household (blue in all the charts) — was also growing.

Income inequality surely existed in the ’80s and ’90s, but the pie available was growing and Americans in the middle were getting a piece of it. Then incomes slid during the 2001 recession at the beginning of George W. Bush‘s presidency and never quite recovered, even as GDP per capita continued to grow. The recession that began in December 2007 sent both measures falling.

Since Mr. Obama took office, GDP per capita has reclaimed its lost ground. But these gains have not accrued to the median household.

A look at the year over year change shows the breakdown. In the 1980s and 1990s, median incomes and GDP per capita both rose. But beginning around the year 2000, per capita GDP has posted a number of solid years, while median household income has had few years of positive growth.

In 2013, median household income climbed for the first time since 2007, but by only a tiny bit — less than $200.

Since 1999, this has opened a widening gyre between the two measures. GDP per capita has risen, while median incomes have fallen. Mr. Obama would like credit for the recovery of the former. But it’s the stagnation of the latter that has left so many households dissatisfied.

How Obama Is Caught Between Economic Growth and Shrinking Incomes
Josh Zumbrun
Fri, 03 Oct 2014 12:00:08 GMT

Just when we thought we were out we’re pulled back in!

Once again, the United States has let itself be manipulated and baited into an undeclared war, for the second time in the Middle East.  The initial scope has been proclaimed to be limited, but as in the past, it isn’t clear what will keep that scope limited.

Now in the sixth decade of life, I feel like I have seen this movie before, and I fear how it will end.  Mostly I fear I’ve seen the end before.  In my life I’ve seen Vietnam, Gulf War I, Afghanistan, and Gulf War II.  Of these, only one in retrospect seems like it had realistic, necessary and achieved goals:  Gulf War I.

Vietnam, of course escalated steadily for almost a decade, failed to stop the tumbling of dominos by Communists in Southeast Asia, and its failure to do so never really showed why it mattered to the US anyway.

Gulf War I had a clear and achievable goal:  removing Sadam from Kuwait.  Leaving him in Kuwait still seems in retrospect like it wouldn’t have been wise  .  That limited goal was also achieved.

Afghanistan at its outset seemed and seems like it was unavoidable.  9/11 did require a response.  Unfortunately, the mission became nation building, and in that culture so different from that of US – tied culturally to Europe-the US has sunk live and treasure to no apparent end other than successfully dispersing the Al Qaeda nest.  At the least many goals were not realistic or achieved.

Gulf War II never had a goal other than taking out our collective anger on an Arab state.  It felt good at first, but was likely never necessary.  Over time the goal morphed as we realized that we had to leave some kind of state in our wake.  Unfortunately, that necessary goal has proved beyond our grasp.

Because of that fact, now we are heading back to Iraq in response to the chaos we have left there.  I can’t help but think that we will in the end only further make a mess of that area.

Utah Trip 2014 # 1

2014-07-26T184046 0000_14747684481_o

This is at Zion National Park on July 26, 2014.

Prayers for the End of Abortion

Today I was in Church and we prayed for lawmakers, and health care givers to value life.  On the face of it that’s hard to fault, but I found myself disturbed by what we didn’t also pray for.

We did not pray for the woman choosing to abort to have a change of heart,  We did not pray for the woman that may later choose to abort to abort to avoid pregnancy.  We did not pray for the woman who consider to abort to have more ways to care for their unborn child and to choose to bring that life in her to fruition.

Whether one is pro life or pro choice, as we have labeled the two sides of this 41 year old debate, the question seems to boil down to when does life begin before birth.  On this I find it hardest to understand those who are pro choice.  How can you be so sure of when life begins?  That leaves me unable to believe that any good society doesn’t wants as few abortions as possible.  I am unable to be anything close to sure that abortion is not murder.

That said, I’m still also uncomfortable with the idea that using the power  of the state, the use of sanctioned force, to reduce abortion is in fact moral, or at least the best way to save babies from abortion.  I certainly don’t think that the use of force against abortionists, and their clients are the only approach we should take for the protection of life.

I think we should offer as many alternatives to abortion as we can.  We should encourage birth control.  We should make it as easy for unwanted babies to be adopted.

I think we should pray for those things.

Most of all, I think of the woman choosing to abort to have a change of heart,  We did not pray for the woman that may later choose to abort to abort to avoid pregnancy.

Why didn’t we?

Canada pulls the plug on the U.S. Keystone Pipeline – will send oil to Asia

I like President Obama, but I have never been able to understand why his administration is so lukewarm on increased supplies of North American energy, including that from Canada. It is one of the bright spots in this mediocre economic climate that we all have suffered from.

Watts Up With That?

Approves Asia Supply Route, Ignores US Route

H/T Eric Worrall and Breitbart – Obama’s inability to make a decision on Keystone has finally yielded a result – Canada has made the decision for him.

Breitbart reports Canada has just approved the Enbridge Northern Gateway Project – a major pipeline to ship Canadian oil to Asia.

The Canadian oil will still be burnt – in Asia, instead of America.

View original post 140 more words

Jesus and Ayn Rand

I can’t add much, other than it has always amazed me that Christian conservative like Ayn Rand, when she was such a militant atheist.

Prometheus Unbound

What sort of conservatism blends Jesus with Ayn Rand? Oh, that would be contemporary Tea Party conservatism.

But why isn’t it more widely noticed that “Christian libertarian” is an oxymoron? I would argue that this has to do with the human mind’s capacity for compartmentalization and cognitive dissonance, for Jesus and Rand simply do not go together coherently. Buckley, before he died, was less illusioned: he saw that his Catholicism and Randianism are not a match. Rand herself recognized this as well. She was an atheist.

View original post

The Future is still Bright!


Trulia chief economist Jed Kolko wrote this morning:

“Median age in US ~38. But modal age is 23. Five most common ages: 23, 24, 22, 54, 53.”

This is an important change in the modal age. As I’ve noted before, by 2020, eight of the top ten largest cohorts (five year age groups) will be under 40, and by 2030 the top 11 cohorts will be the youngest 11 cohorts.
Demographics is a key driver of economic growth, and although most people focus on the aging of the “baby boomer” generation, the movement of these younger cohorts into the prime working age is another key story in coming years. Here is a graph of the prime working age population (this is population, not the labor force) from 1948 through May 2014.
Prime Working Age PopulatonClick on graph for larger image.
There was a huge surge in the prime working age population in the ’70s, ’80s and ’90s – and the prime age population has been mostly flat recently (even declined a little).
The prime working age labor force grew even quicker than the population in the ’70s and ’80s due the increase in participation of women. In fact, the prime working age labor force was increasing 3%+ per year in the ’80s!
So we when compare economic growth to the ’70s, ’80, or 90’s we have to remember this difference in demographics (the ’60s saw solid economic growth as near-prime age groups increased sharply).
The good news is the prime working age group will start growing again by 2020, and this should boost economic activity.
But that is medium term – in the near term, the reasons for a pickup in economic growth are still intact:1) the housing recovery should continue, 2) household balance sheets are in much better shape. This means less deleveraging, and probably a little more borrowing, 3) State and local government austerity is over (in the aggregate),4) there will be less Federal austerity this year, 5) commercial real estate (CRE) investment will probably make a small positive contribution this year.
For new readers: I was very bearish on the economy when I started this blog in 2005 – back then I wrote mostly about housing (see: LA Times article and more here for comments about the blog). I started looking for the sun in early 2009, and now I’m more optimistic.
Last year I wrote The Future’s so Bright …. In that post I outlined why I was becoming more optimistic.
Here are some updates to the graphs I posted last year.  Several of these graphs have changed direction (as predicted) since I wrote that post.  For example, state and local government employment is now increasing, and household debt has started increasing.
Total Housing Starts and Single Family Housing StartsThis graph shows total and single family housing starts. Even after the 28.2% increase in 2012, and 18.5% increase in 2013 (to 925 thousand starts), starts are still way below the average level of 1.5 million per year from 1959 through 2000.
Demographics and household formation suggests starts will return to close to that level over the next few years. That means starts will probably increase another 50% or so over the next few years from the May 2014 level of 1 million starts (SAAR).
Residential investment and housing starts are usually the best leading indicator for the economy, so this suggests the economy will continue to grow over the next couple of years.
State and Local GovernmentThis graph shows total state and government payroll employment since January 2007. State and local governments lost 129,000 jobs in 2009, 262,000 in 2010, 249,000 in 2011, and 33,000 in 2012.
In 2013, state and local government employment increased by 44,000 jobs.
This year, through May 2014, state and local employment is up 46,000.   So it appears that most of the state and local government layoffs are over – and the economic drag on the economy is over.
US Federal Government Budget Surplus DeficitAnd here is a key graph on the US deficit. This graph, based on the CBO’s May projections, shows the actual (purple) budget deficit each year as a percent of GDP, and an estimate for the next ten years based on estimates from the CBO.
As we’ve been discussing, the US deficit as a percent of GDP has been declining, and will probably remain under 3% for several years.  
Here are a couple of graph on household debt (and debt service):
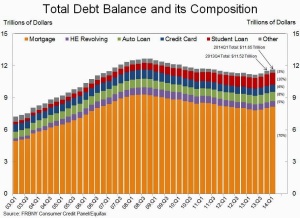
Total Household Debt This graph from the the NY Fed shows aggregate household debt increased $129 billion in Q1 2014 from Q4 2013.
From the NY Fed: “In its Q1 2014 Household Debt and Credit Report, the Federal Reserve Bank of New York announced that outstanding household debt increased $129 billion from the previous quarter. The increase was led by rises in mortgage debt ($116 billion), student loan debt ($31 billion) and auto loan balances ($12 billion), slightly offset by a $27 billion declines in credit card and HELOC balances. Total household indebtedness stood at $11.65 trillion, 1.1 percent higher than the previous quarter. Overall household debt remains 8.1 percent below the peak of $12.68 trillion reached in Q3 2008. “
There will be some more deleveraging ahead for certain households (mostly from foreclosures and distressed sales), but it appears that in the aggregate, household deleveraging is over.
Financial ObligationsThis graph is from the Fed’s Q1 Household Debt Service and Financial Obligations Ratios. These ratios show the percent of disposable personal income (DPI) dedicated to debt service (DSR) and financial obligations (FOR) for households.
The overall Debt Service Ratio decreased in Q1, and is at a record low.  Note: The financial obligation ratio (FOR) is also near a record low  (not shown)
Also the DSR for mortgages (blue) are near the low for the last 30 years.  This ratio increased rapidly during the housing bubble, and continued to increase until 2007. With falling interest rates, and less mortgage debt (mostly due to foreclosures), the mortgage ratio has declined significantly.
This data suggests household cash flow is in much better shape than a few years ago.
AIA Architecture Billing IndexAnd for commercial real estate, here is the AIA Architecture Billings Index. This is usually a leading indicator for commercial real estate, and even though the index has been moving sideways near the expansion / contraction line recently, the readings over the last year suggest some increase in CRE investment in 2014.
Overall it appears the economy is poised for more growth over the next few years.
As I noted at the beginning of this post, in the longer term I remain very optimistic. The renewing of America was one of the key points I made when I posted the following animation of the U.S population by age, from 1900 through 2060. The population data and estimates are from the Census Bureau (actual through 2010 and projections through 2060). 

U.S. Population 1990 through 2060

The Future is still Bright!
Bill McBride
Thu, 26 Jun 2014 16:56:00 GMT

Reconciling Hayek’s and Keynes’ views of recessions


Paul Beaudry, Dana Galizia, 1 June 2014
The views of Hayek and Keynes about the causes and consequences of recessions are often presented as opposing. According to Hayek, recessions are working out excessive investments, whereas Keynes regarded them as demand shortages. This column argues that these perspectives are not mutually exclusive. Recessions may reflect periods of liquidation but this could be associated with inefficient adjustment involving unemployment and precautionary savings. Stimulative policy may be desirable even if it delays the full recovery.
Full Article: Reconciling Hayek’s and Keynes’ views of recessions

Reconciling Hayek’s and Keynes’ views of recessions
Sun, 01 Jun 2014 00:00:00 GMT

What the State Produces


In anarchist literature, one often finds the contention that the State produces nothing, and is entirely parasitic on the rest of society.
This claim is false. Of course, it is true for some things that modern states do, such as the provision of welfare. But it is false applied to the state as a whole, because there is one service that is highly productive, and that only the state can provide: the service of being the final arbiter for all disputes between its members. This service must, logically, come from a monopoly provider: if there are multiple providers of arbitration at the same level, then none of them are final. (And that is why, if a network of ancap defense agencies can provide this service, they will, in fact, compose a state. And if they can’t provide it, then we will have “anarchy” in the bad sense of social chaos.)
Once one focuses on this service, one can easily understand why German barbarians would fight to get inside the Roman Empire: both productivity and security go up in the presence of such a final arbiter. And that is why we have never seen any wealthy, stateless societies.

What the State Produces
Gene Callahan
Wed, 14 May 2014 23:10:00 GMT